Gisela Washington · 26 October 2026
Tracking Linked Coastal Transformations via Joint Monitoring Programs
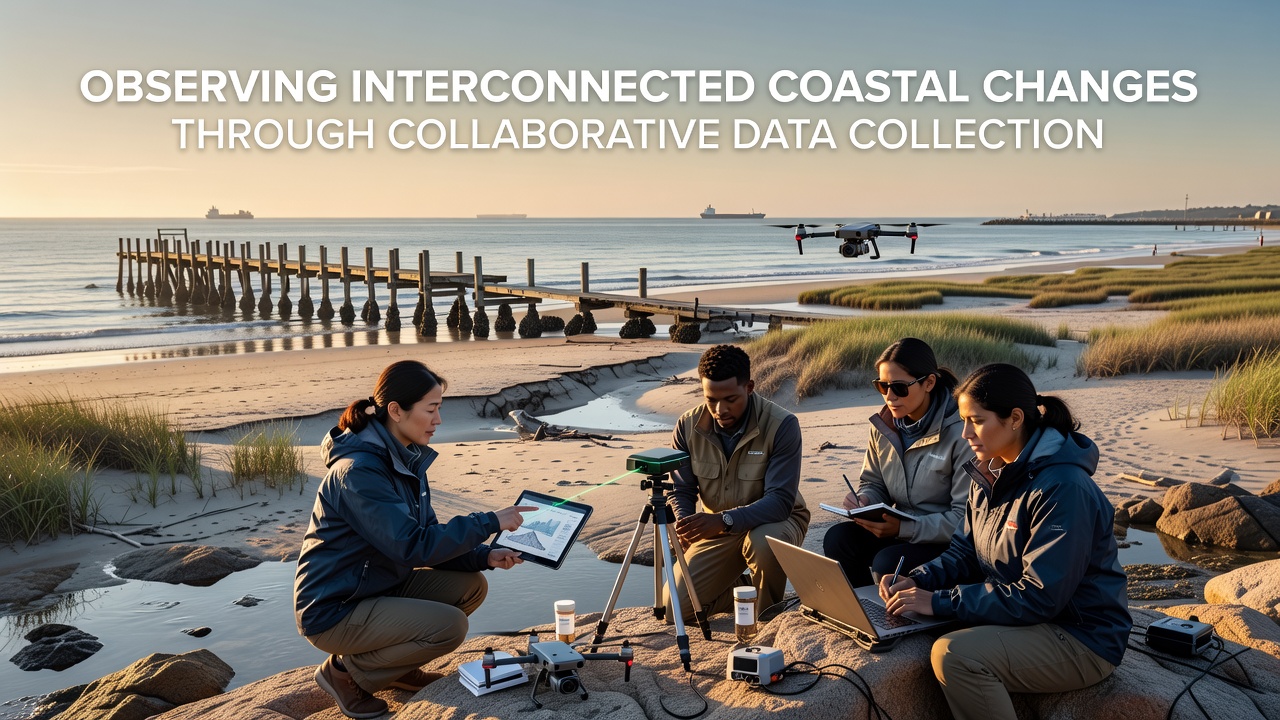
Coastal zones experience simultaneous shifts in temperature, salinity, sediment movement, and species distribution, and collaborative data collection brings these elements into clearer view. Teams from government agencies, universities, and local groups combine sensor networks with field observations to map how one change influences others across connected systems. This approach reveals patterns that single-source monitoring often misses, such as the way altered currents affect both nutrient flows and structural stability of nearshore features.
Building Shared Data Frameworks Across Regions
Multiple organizations coordinate protocols so measurements from one site align with those from distant locations. In practice this means standardizing variables like dissolved oxygen levels, wave energy, and benthic community composition. When datasets merge, analysts identify correlations between rising sea surface temperatures and accelerated erosion rates in areas where protective vegetation has declined. Such linkages emerge only after consistent collection methods allow direct comparison over time and space.
Programs operating along North American and European coastlines exchange raw readings through centralized repositories. Technicians verify instrument calibration quarterly while community participants log supplementary visual observations of shoreline retreat. The combined records show how localized storm surges compound longer-term sea level trends, producing cumulative effects on intertidal zones that neither dataset captured alone.
Interconnections Revealed Through Integrated Records
Evidence from merged datasets indicates that changes in freshwater input alter salinity gradients, which in turn influence the distribution of filter-feeding organisms responsible for water clarity. Researchers tracking these sequences note corresponding shifts in sediment deposition patterns because clearer water permits greater light penetration and subsequent plant growth that stabilizes substrates. These chains of influence become visible only when data streams from hydrology, biology, and geomorphology remain synchronized.
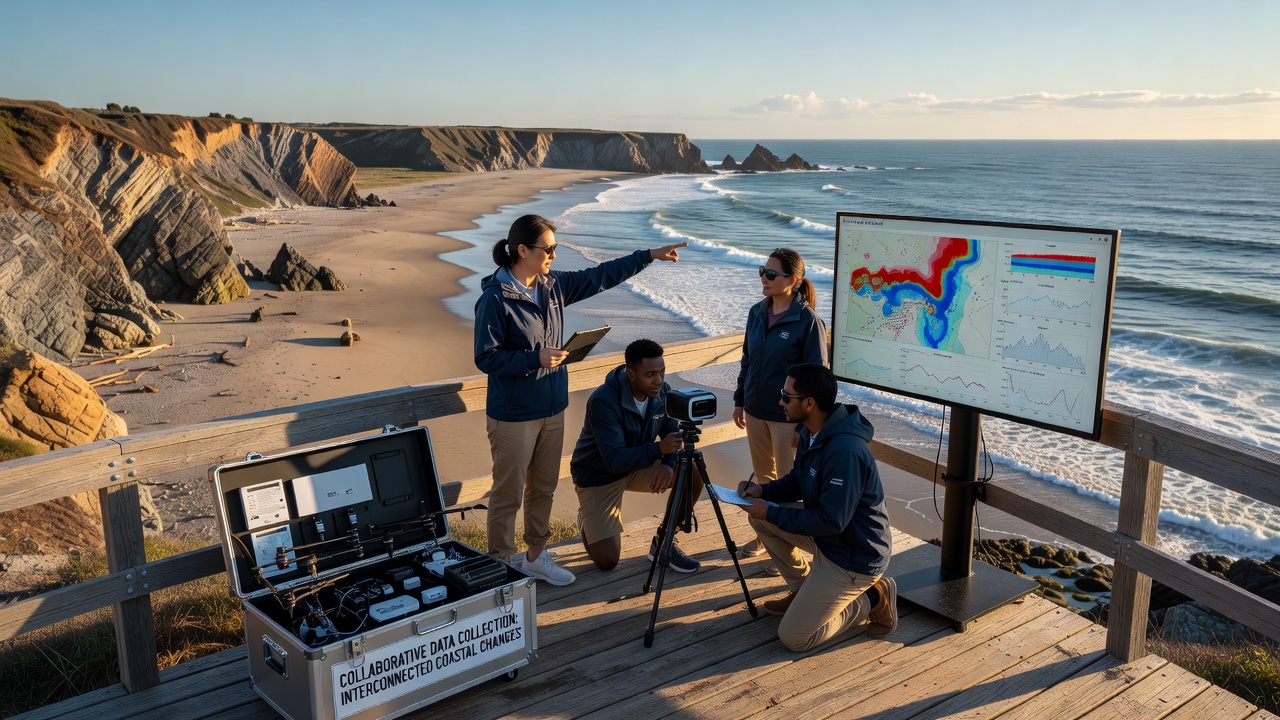
October 2026 marks the scheduled release of a multi-year synthesis drawing on contributions from over thirty participating groups. Preliminary figures already demonstrate how vessel traffic corridors coincide with localized increases in suspended solids that affect light availability for submerged vegetation. The synthesis will also incorporate satellite-derived chlorophyll measurements cross-checked against in-situ samples to confirm productivity trends across entire bays rather than isolated sampling points.
Technology Supporting Broader Coverage
Autonomous platforms now transmit real-time readings from previously inaccessible offshore stations, while fixed moorings supply continuous vertical profiles through the water column. Software tools align these high-frequency records with lower-frequency but spatially extensive surveys conducted by research vessels. The resulting four-dimensional datasets allow modelers to test hypotheses about how a single driver, such as altered river discharge, propagates through physical, chemical, and ecological compartments simultaneously.
One documented case from the Pacific Northwest shows that a multi-week period of elevated river flow reduced nearshore salinity enough to stress certain kelp populations, which then reduced habitat complexity and altered associated fish assemblages. Parallel observations from the same period in the Gulf of Maine recorded comparable salinity drops but different species responses because baseline temperatures differed. Collaborative comparison highlighted the role of thermal context in modulating biological outcomes.
Expanding Participation and Data Quality
Training workshops equip volunteers with standardized sampling kits and digital reporting apps that feed directly into shared databases. Quality control procedures flag outliers for review by professional staff before inclusion in long-term archives. This tiered system increases spatial density of observations while maintaining traceability back to original collection events. Expanded coverage proves especially useful along remote stretches where permanent instrumentation remains cost-prohibitive.
Cross-validation exercises compare volunteer-collected turbidity readings against laboratory-analyzed water samples drawn at the same locations. Agreement rates above 85 percent support continued integration of citizen contributions. Over successive seasons the denser observation grid improves resolution of short-lived events such as harmful algal blooms that develop between scheduled research cruises.
Conclusion
Joint data initiatives continue to expose previously hidden relationships among physical forcing factors, chemical conditions, and biological responses along coastlines worldwide. By maintaining consistent standards and open exchange, participating groups generate records that support both immediate management decisions and longer-term projections of system behavior under changing climate conditions. The October 2026 synthesis represents one milestone in an ongoing process of accumulating comparable observations across expanding geographic networks.